 vibgg
Guides · 4 min read
Funding rate history: how to read past rates and download them
What a perpetual's funding history shows that today's rate cannot: settled versus predicted rates, 7, 30 and 90-day averages, and how to download the record as CSV.
·
Today's funding rate is one reading of a number that resets at every settlement. The history shows what holding the contract actually cost: add up the settled rates over the period you plan to hold, and compare exchanges over the same days. That sum, converted to dollars, is the funding a position paid or received.
Settled rates and predicted rates
Exchanges show two different funding numbers. The predicted or next rate is a running estimate that changes until the settlement happens. The settled rate is the one actually charged at that settlement, and it is the only one that tells you what a position paid.
The history tables on vibgg use each exchange's own published record of settled rates, reaching back 90 days. The most recent settlement can briefly show the last estimate seen before it settled, until the exchange's record catches up; the download below marks every row with which of the two it is.
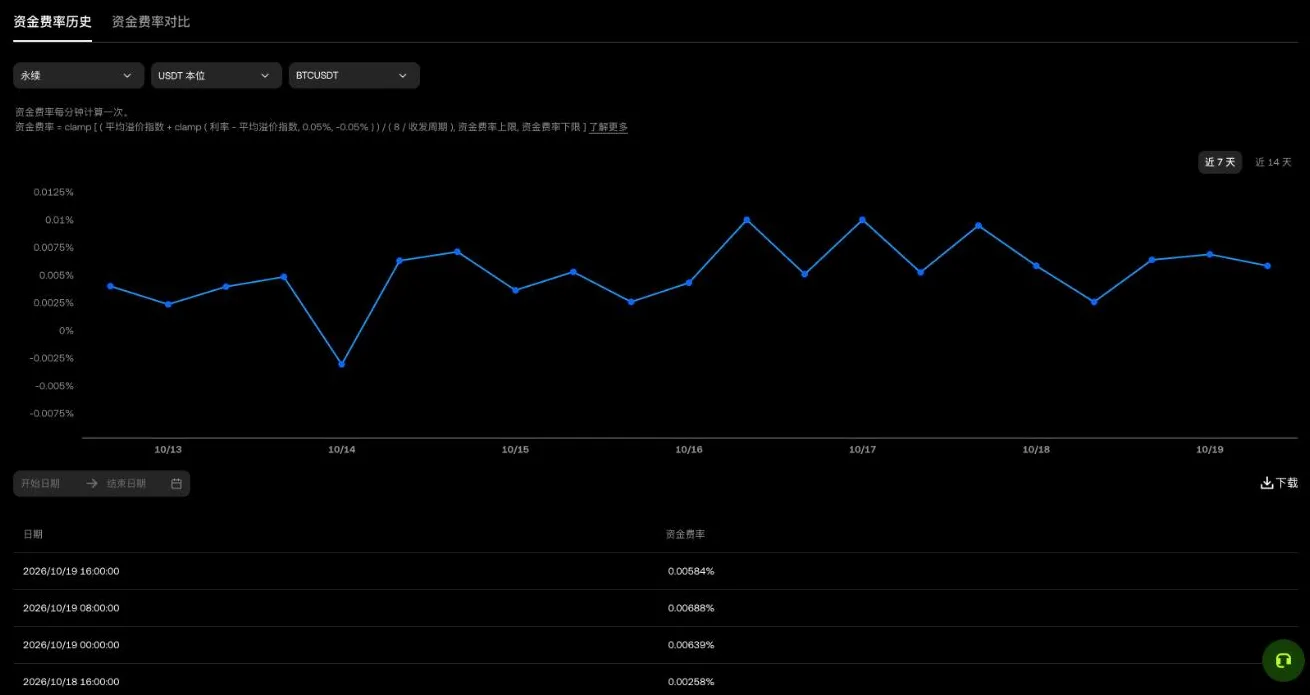
BTC funding history on each exchange
BTC-USDT's settled funding on each exchange, averaged over the last 7, 30 and 90 days and annualised. A positive average is what a long paid; a negative one is what a long received.
| Exchange | Last settled | 7-day average | 30-day average | 90-day average | Settlements |
|---|---|---|---|---|---|
| Binance | +0.0066% | 5.74% | 3.54% | 5.79% | 270 |
| OKX | +0.0057% | 6.82% | 4.19% | 5.47% | 270 |
| Bybit | +0.0100% | 5.63% | 3.70% | 4.46% | 270 |
| Bitget | +0.0027% | 7.44% | 6.41% | 5.84% | 270 |
| Gate | +0.0043% | 4.93% | 2.48% | 3.72% | 270 |
In dollars: over the last 30 days, BTC-USDT's settlements on Binance added up to +0.2905% of the position value. For a $10,000 long held the whole time, that is $29.05 of funding; a negative figure means the long was paid.
“Last settled” is per settlement; the averages are annualised as a simple rate, so they compare directly with the 10.95% a year that the default 0.01% every eight hours would cost. The table updates with the live data; the BTC-USDT funding page has the full daily history.
Why the average says more than today's rate
Annualising a single rate assumes it lasts a year. It rarely lasts a day. Funding swings with demand for leverage: it can spike during a rally and turn negative in a sell-off. An average over the period you will actually hold includes those swings, so it is a far better estimate of what the position will cost than the number shown today.
Comparing the windows tells you something too:
- 7-day well above 90-day: funding has risen recently. It may be a short spike, so do not plan a long hold on the latest rate.
- 7-day close to 30-day and 90-day: funding has been steady, and the average is a reasonable planning number.
- Averages that change sign between windows: who pays whom has flipped. A trade that relies on receiving funding needs particular care.
Compare the same days, not the same number of settlements
An eight-hour contract settles 90 times in 30 days; an hourly contract settles 720 times. Comparing “the last 100 settlements” would set a month against four days. Compare totals over the same calendar period instead, which is how every history table on vibgg is built.
Watch for short records as well. A contract that an exchange listed recently has only a few days of history, and its average is not comparable with a 30-day one. vibgg marks such a record with the date its data starts and leaves it out of the comparisons.
How to download funding rate history
Every contract's history is available as a CSV file or as JSON, free and without an API key:
/api/v1/funding/history?symbol=BTC-USDT&format=csv
Change symbol to any contract on the site, in the form ETH-USDT. Add days=30 for a shorter window; the maximum is 90. Leave out format=csv to get JSON. Try it with BTC-USDT funding history as CSV.
The CSV has one row per settlement and exchange:
| Column | Meaning |
|---|---|
time_utc | Settlement time in UTC |
exchange | The exchange, for example binance |
funding_rate | The rate as a decimal: 0.0001 is 0.01% |
funding_rate_pct | The same rate as a percentage |
interval_hours | Hours since the previous settlement |
source | exchange_history for the exchange's published record, last_estimate for a recent settlement not yet in that record |
To get a position's funding from the file, add up funding_rate for the exchange and dates you want and multiply by the position value. A positive total is what a long paid and a short received. The data is published under CC BY 4.0: use it freely, with a link to vibgg.
What history cannot tell you
Past funding does not predict future funding. A contract that was cheap to hold for three months can become expensive within a day when positioning changes. Use the history to set expectations and to compare exchanges fairly, then check the live rate before you trade.
Funding is also only one part of the cost. Trading fees and the spread are paid every time a position is opened or closed; the trading cost calculator combines them, and the funding fee calculator sets today's rate against the 30-day average on every exchange.